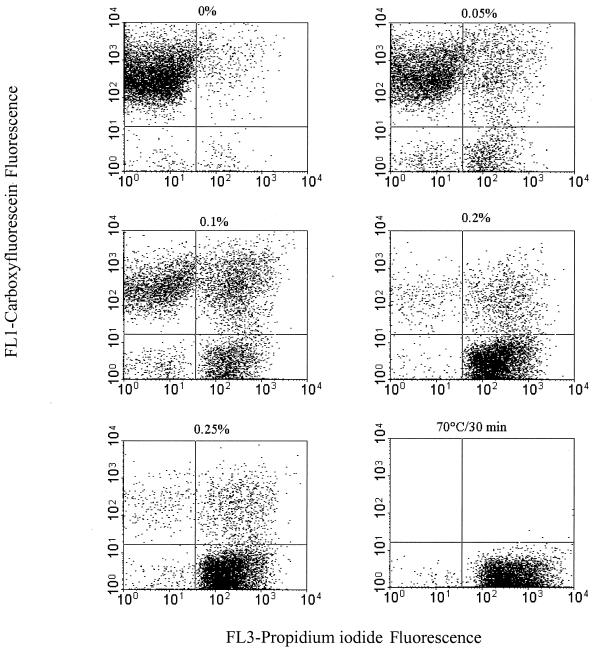
FIG. 5.
Multiparameter dot plots of B. lactis DSM 10140 representing PI fluorescence versus cF fluorescence. Cultures were exposed for 10 min to 0, 0.05, 0.1, 0.2, or 0.25% dBS in anaerobic potassium phosphate buffer (50 mM; pH 7; containing 1 mM DTT) for 10 min at 37°C. Subsequently, all samples were stained simultaneously with 10 μM cFDA and 5 μg of PI/ml and were analyzed by FCM. Three main subpopulations, corresponding to viable cF-stained cells (upper left quadrant), injured cells double stained with PI and cF (upper right quadrant), and dead PI-stained cells (lower right quadrant), can be readily differentiated.

