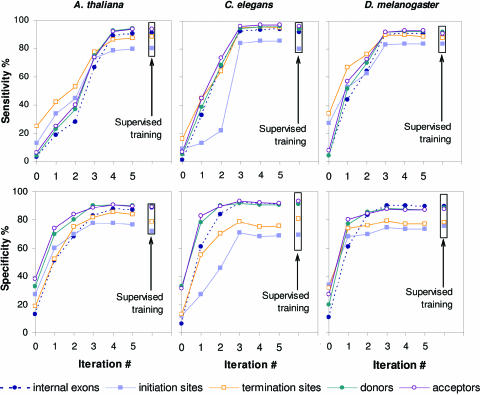
Figure 3.
Gene prediction accuracy parameters (Sn and Sp), as determined on the test sets for A.thaliana, C.elegans and D.melanogaster, are shown as functions of the iteration index. For gene predictions produced by models defined at initialization, the Sn and Sp values are shown at zero index value. Upon application of GeneMark.hmm ES-3.0 to genomes of A.gambiae, C.intestinalis, C.reinhardtii and T.gondii we observed similar dynamics of change of the Sn and Sp parameters measured on the relevant test sets (data not shown).

