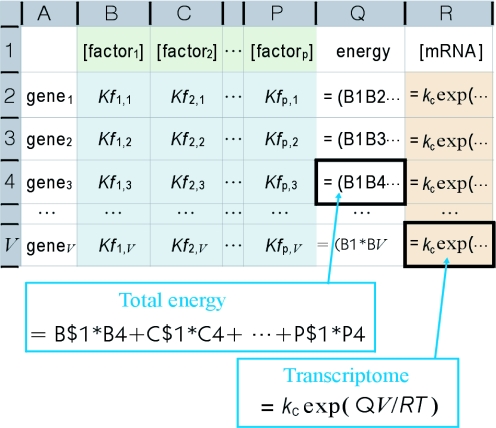
Figure 3.
Transcriptome estimation from genomic information. The matrix of coefficients (blue) indicates quantitative decoded genome information determined by interactions between genes and protein factors. The concentrations of transcripts (orange) are calculated from the activity concentrations for each of the protein factors (green). The transcriptome is determined from the values in column R. The activity concentrations in row 2 are determined by solving the simultaneous equations analytically with a partial set of column R values supplied by experimental microarray data.

