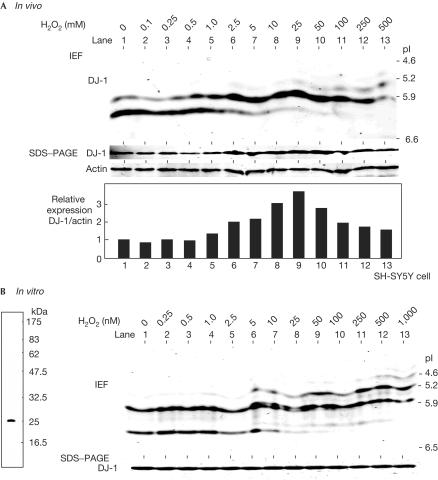
Figure 1.
pI shift of DJ-1 after its treatment with hydrogen peroxide. (A) SH-SY5Y cells were treated with various concentrations of hydrogen peroxide for 12 h, and proteins in the extracts were then analysed by isoelectric focusing phoresis gel (IEF, upper panel) or PAGE containing SDS (SDS–PAGE in the lower panel) as described in Methods. Intensities of the bands of DJ-1 and actin were measured and are shown as ‘relative expression'. (B) In all, 1 μg of recombinant DJ-1 was reacted with various concentrations of hydrogen peroxide for 30 min at room temperature and subjected to isoelectric focusing Diet phoresis and SDS–PAGE electrophoresis as described in A (right panel). The recombinant DJ-1 used in this experiment was separated on PAGE containing SDS and stained with Coomassie brilliant blue R-250 (left panel).

