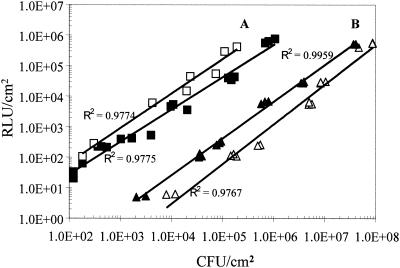
FIG. 2.
Correlation of bioluminescence (relative light units [RLU]) and culture regimen-dependent viable cell count (CFU per square centimeter) measured at 10°C. The A lines show the correlation on cheese after 14 days of storage (open squares) and during the first 3 days after inoculation (closed squares). The B lines show the correlation for Y. enterocolitica on BHI agar with 2.5% salt (closed triangles) and without salt (open triangles) on the first 5 days. The background luminescence of cheese and BHI agar has been subtracted. Immediately after the light intensity was measured, the plates or cheeses were used to determine the viable counts (see text).

