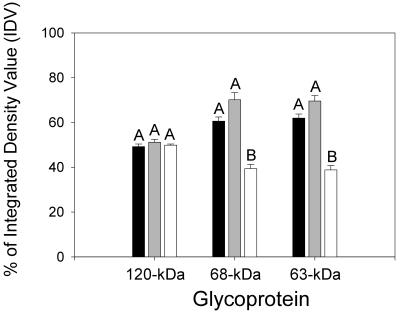
FIG. 6.
Spot densitometry of SBA binding to 120-, 68- and 63-kDa BBMV proteins from YDK (solid bars), F1 (gray bars), and YHD2 (open bars) larvae. Binding of SBA to protein bands was analyzed by using the AlphaImager software as described in Materials and Methods. Different letters indicate significant differences at the 95% confidence level for the intensity of SBA binding for each protein.

