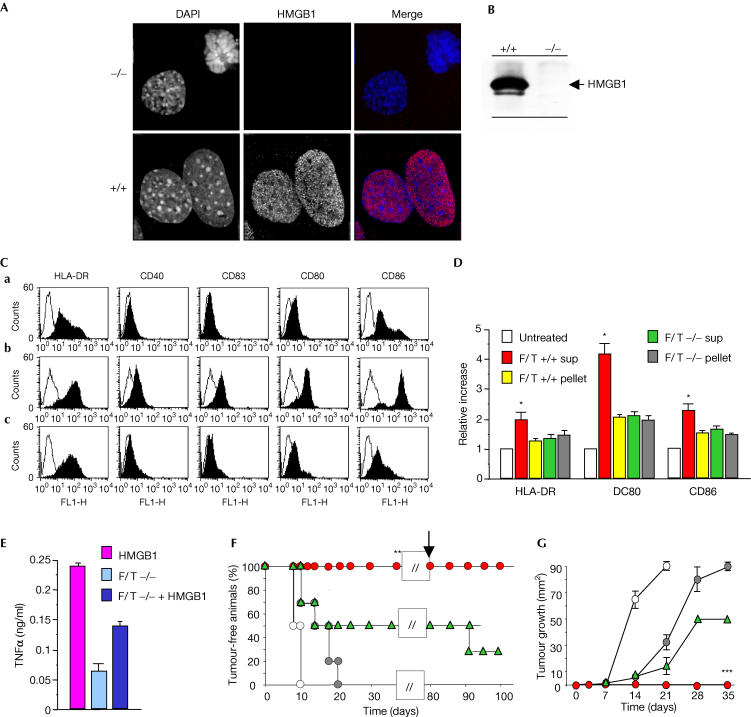
Figure 2.
HMGB1 is required for the in vivo adjuvant activity of necrotic cells. (A) HMGB1 is expressed in the nuclei of wild-type (+/+, bottom) fibroblasts, whereas Hmgb1−/− fibroblasts (top) do not express it. Nuclei are revealed by staining with DAPI, and HMGB1 expression by immunohistochemistry. (B) HMGB1 in the supernatant of necrotic wild-type (+/+) or Hmgb1 knockout (−/−) fibroblasts was revealed by immunoblotting. (C) The expression of HLA-DR, CD40, CD83, CD80 and CD86 was assessed by flow cytometry on untreated immature DCs (a) or DCs treated with the supernatants of wild-type necrotic fibroblasts (F/T +/+; b) or their −/− counterparts (c). Only DCs treated with supernatants of necrotic Hmgb1+/+ fibroblasts had significantly higher expression of the markers (P<0.005). (D) The expression of HLA-DR, CD80 and CD86 was assessed on immature DCs, either untreated or treated with the supernatants of necrotic Hmgb1+/+ fibroblasts (F/T +/+ sup), insoluble fractions of necrotic Hmgb1+/+ fibroblasts (F/T +/+ pellet), supernatants of necrotic Hmgb1−/− fibroblasts (F/T −/− sup) and insoluble fractions of necrotic Hmgb1−/− fibroblasts (F/T −/− pellet). Results are expressed as a relative increase (y-axis) in surface expression over untreated DCs. DCs treated with pellets or F/T −/− sup had significantly lower expression of the different markers (*P<0.01). Experiments were repeated at least three times with DCs from different donors. (E) The production of TNF-α by immature DCs treated with F/T −/− sup or F/T −/− sup reconstituted with purified recombinant HMGB1 was assessed in the cell culture supernatants. (F) The development of lymphoma was evaluated in C57BL/6 mice vaccinated with PBS (saline), apoptotic RMA cells or apoptotic RMA cells in the presence of the supernatants of wild-type necrotic fibroblasts (F/T +/+) or from their Hmgb1−/− counterparts (F/T −/−). The results shown depict the fraction of tumour-free mice (y-axis) at different times after injection of living RMA lymphoma cells (x-axis). Protected mice were re-challenged on day 80 (arrow). (G) The results shown depict the mean diameter of the growing tumour (y-axis) at different times after administration of living RMA cells (x-axis). Fisher's exact test results for protection and tumour growth were **P<0.005 and ***P<0.001, respectively.

