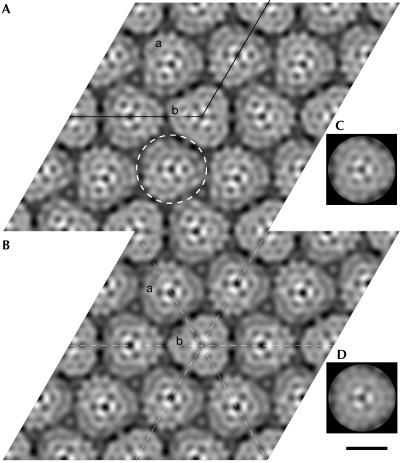
Figure 4.
CryoEM projection maps of AmtB to 12 Å resolution, represented as grey levels. White corresponds to maximum density. (A) Map from six merged images of AmtB crystals with p3 symmetry imposed. One unit cell is outlined. The dashed circle denotes one trimeric particle of AmtB. (B) Projection map as in (A), but with p321 symmetry imposed. The unit cell is not outlined but is the same as in (A). The dashed lines show two-fold symmetry axes. In both maps, the two crystallographically independent particles are labelled ‘a' and ‘b'. (C,D) Three-fold rotationally averaged density maps of particle ‘b' from the p3 and p321 maps, respectively. Scale bar, 50 Å.

