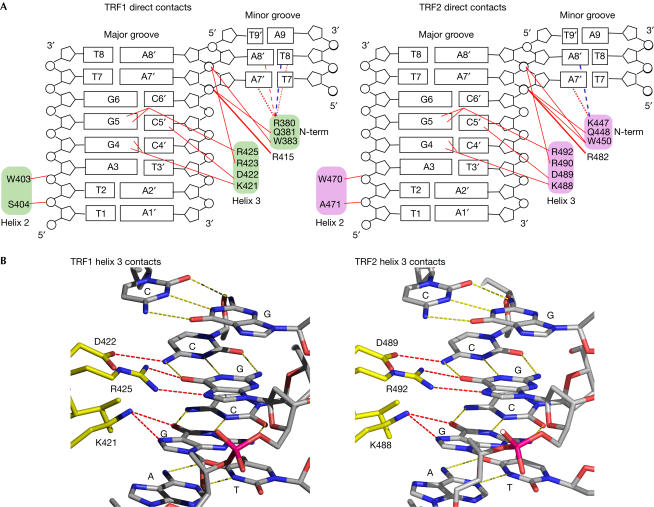
Figure 3.
Summary of direct protein–DNA contacts in the TRF1-Dbd–DNA and TRF2-Dbd–DNA complexes. (A) Maps of protein–DNA contacts. The DNA is represented as an opened-out helix. Red lines indicate direct hydrogen bonds. These contacts are conserved between the two molecules in one complex. Direct contacts in the minor groove made by residues R380 of TRF1 and K447 of TRF2 that differ in the two protein molecules in one complex are indicated by dotted and dashed red lines. A dashed blue line depicts water-mediated contacts. (B) Views at atomic resolution of the hydrogen bonds between residues in the DNA-recognition helix and the bases in the major groove of DNA.

