Figure 1.
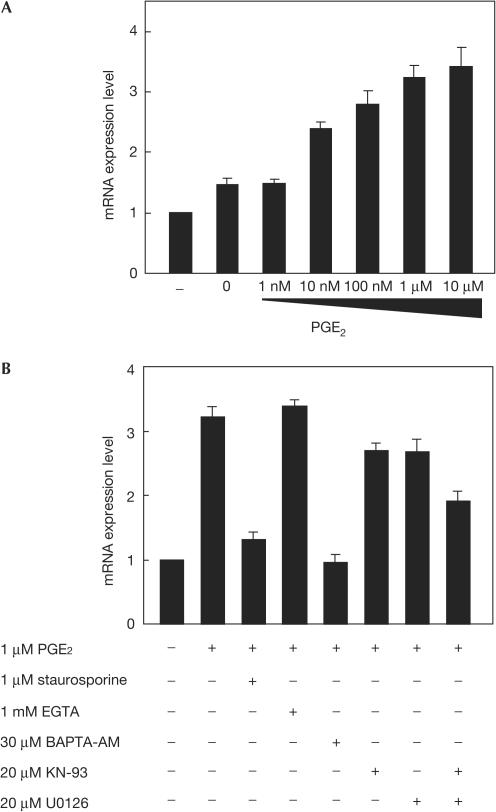
Induction of mPer1 mRNA expression by prostaglandin E2 (PGE2) in NIH3T3 cells. (A) Dose-dependent induction of mPer1 mRNA by PGE2 treatment of NIH3T3 cells. Relative levels of mRNA expression 1 h after the indicated treatment are evaluated by the real-time quantitative PCR method. Each value was normalized to mG3PDH. Values are mean±s.e.m. from three experiments. (B) Effect of inhibitors on mPer1 induction by PGE2 treatment. NIH3T3 cells are treated with the indicated agents 30 min before PGE2 treatment. Values are mean±s.e.m. from three experiments.

