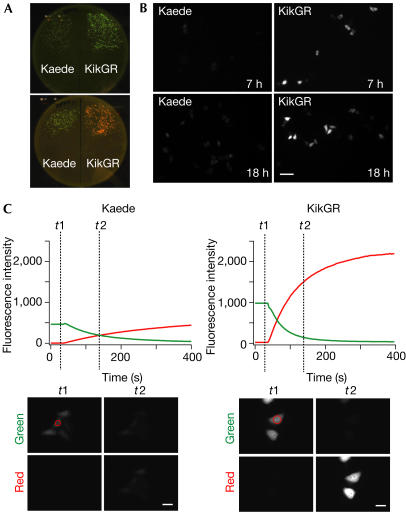
Figure 4.
Performance of KikGR in cells. (A) Escherichia coli colonies expressing Kaede (left) and KikGR (right) on a bacterial plate. Transformed cells were incubated in the dark for 12 h (top), and then left for an hour near a window to allow for photoconversion (bottom). Fluorescence images were taken using a home-made plate image analyser (Sawano & Miyawaki, 2000). (B) HeLa cells expressing Kaede (left) or KikGR (right) at 7 h (top) and 18 h (bottom) after transfection. Scale bar, 100 μm. (C) HeLa cells expressing Kaede or KikGR were photoconverted with violet light (400 nm). Green and red fluorescence intensities were measured with excitation at 475 and 550 nm, respectively, and are plotted against time (top). The green and red fluorescence images at t1 and t2 are shown (bottom). Scale bar, 30 μm. The images in (A–C) were acquired and are displayed under the same conditions for Kaede- and KikGR-expressing cells.

