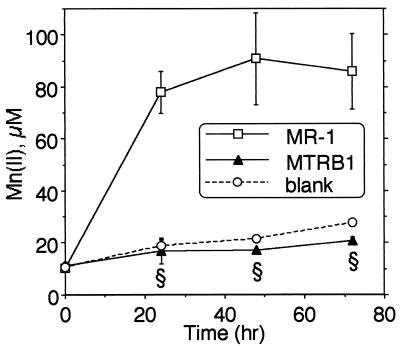
FIG. 3.
Reduction of δMnO2 by MR-1 and MTRB1 cells under anaerobic conditions as determined by the formation of Mn(II) over time. All values are means ± standard deviations for three independent cultures of each strain. For points lacking error bars, the bars were smaller than the symbols. A section sign indicates that the value for MTRB1 was statistically significantly different from the value for MR-1 at a P value of <0.001. The values for MTRB1 were similar to those for the blank (P > 0.05).

