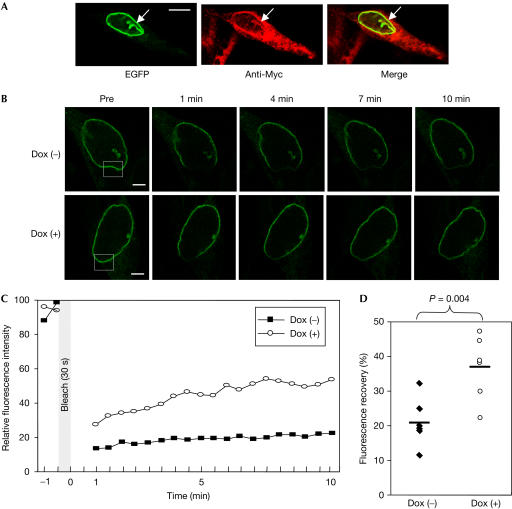
Figure 4.
Agno-induced increase in the lateral mobility of LBR. (A) Colocalization of LBR–EGFP detected by EGFP fluorescence and Agno detected with anti-Myc in 293AG cells. Arrows indicate an invagination of the NE in which LBR–EGFP and Agno are colocalized. Scale bar, 10 μm. (B) FRAP analysis of 293AG cells expressing LBR–EGFP and incubated in the absence or presence of Dox for 24 h. The fluorescence of LBR–EGFP in the boxed regions of the nuclear rim was irreversibly photobleached, and the recovery of fluorescence in these regions was monitored for 10 min. Representative images before (Pre) and at 1, 4, 7 and 10 min after bleaching are shown. Scale bars, 2 μm. (C) Quantification of the fluorescence recovery shown in (B). (D) Summary of fluorescence recovery ratios at 10 min after photobleaching. Each point represents an individual cell and the horizontal bars indicate the median values. The statistical significance of the difference between the two mean values was calculated by Student's two-tailed t-test.

