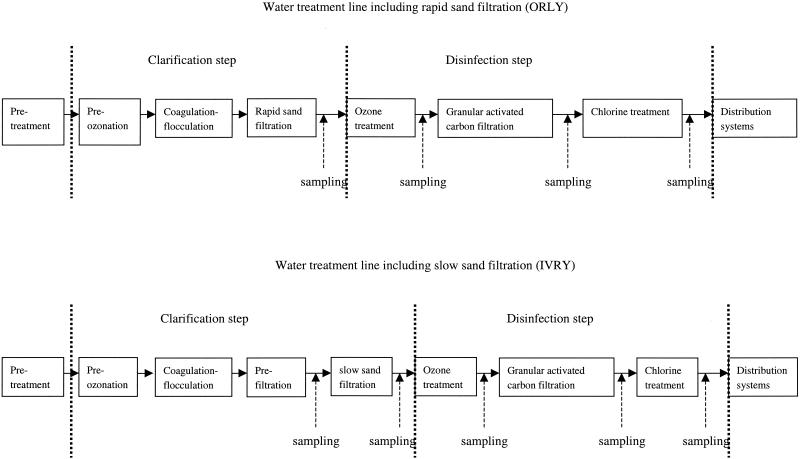
FIG. 2.
Schematic diagram of the two treatment plants in which different preliminary treatment processes (rapid and slow sand filtration processes) are used. The dotted lines delimit the main clarification and disinfection steps. The locations of the sampling sites in the two treatment lines are indicated by dashed arrows.

