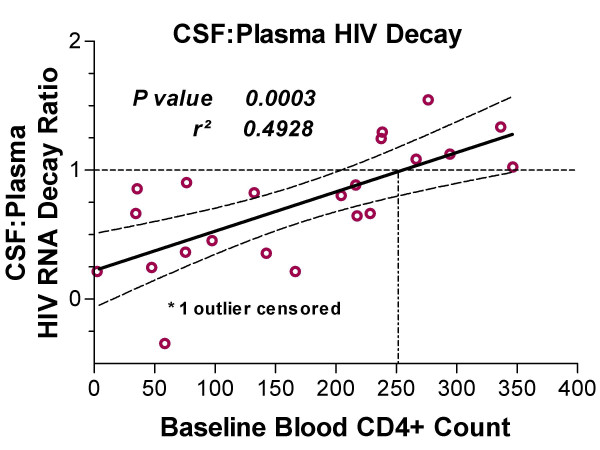
Figure 4.
Relation of CSF:plasma early-phase decay ratio to baseline blood CD4 cell counts. The regression line and 95% confidence intervals were plotted after censoring one subject with CD4 = 1,140 cells/μL. The p-value and r2 of this regression analysis are shown on the figure, while the results of nonparametric analysis are discussed in the text. The horizontal broken line designates the point at which plasma and CSF decay are equal (ratio of 1) and the vertical broken line signals the point where this crosses the regression line – near a blood CD4 count of 250 cells/μL.

