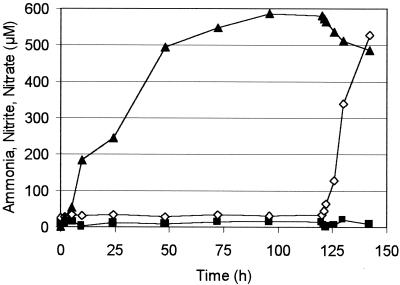
FIG. 3.
Ammonia (▪), nitrite (◊), and nitrate (▴) concentrations in a reactor before (0 to 120 h) and after (120 to 142 h) the addition of N. eutropha. The NO2 concentration was adjusted to 200 ppm. The cell concentrations were adjusted to 108 B. anammoxidans cells ml−1 and 108 N. eutropha cells ml−1.

