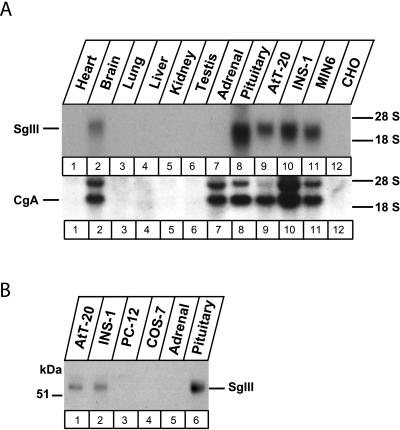
Figure 6.
Tissue distribution of SgIII and CgA analyzed by Northern blot (A) and Western blot (B). Total RNA (10 μg) from the indicated tissues and cell lines were run on an agarose gel; this blot was hybridized with a 32P-labeled cDNA probe for SgIII and CgA (A). Cell lysates (25 μg protein) from the indicated tissues and cell lines were run on an SDS-PAGE for immunoblotting using the antibody to SgIII (B).

