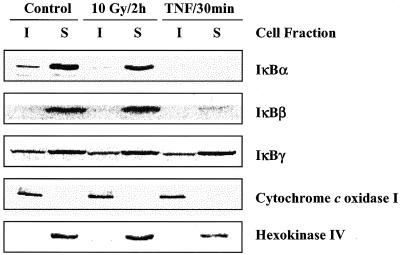
Figure 5.
IκBα, IκBβ, and IκBγ protein levels in insoluble and soluble fractions of U251 cells after exposure to IR or TNF-α. Cells were mock irradiated, irradiated (10 Gy, 2 h), or treated with TNF-α (10 ng/ml, 30 min) and collected for immunoblot analysis. Cytochrome c oxidase I and hexokinase IV were used as markers of the insoluble and soluble fractions, respectively.

