Figure 1.
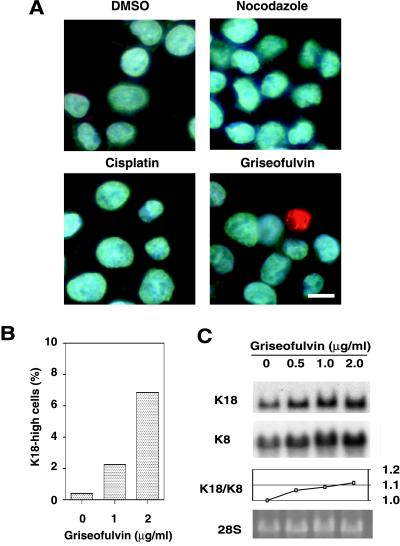
Griseofulvin-induced increase in the expression of K18 in HepG2 cells. (A) Immunofluorescence analysis of the effect of griseofulvin on the abundance of K18 in HepG2 cells. Cells were incubated for 10 d in the presence of 0.2% dimethyl sulfoxide (vehicle), nocodazole (20 ng/ml), cisplatin (40 ng/ml), or griseofulvin (2 μg/ml), after which they were stained with antibodies to K18 (green) and the DNA-specific dye Hoechst 33258 (blue). Scale bar, 10 μm. (B) Concentration dependence of the effect of griseofulvin on the percentage of cells showing increased expression of K18. Cells were cultured for 10 d in the presence of the indicated concentrations of griseofulvin, after which the percentage of cells showing an increased concentration of K18 was determined. (C) Northern blot analysis of the effect of griseofulvin on the abundance of K18 and K8 mRNA. HepG2 cells were incubated for 10 d in the presence of the indicated concentrations of griseofulvin. Total RNA was then prepared from the cells and subjected to Northern blot analysis with a 32P-labeled K18 and K8 cDNA probes (top and second panels, respectively); the corresponding gel was also stained with ethidium bromide, and the 28S rRNA band is shown as a loading control (bottom panel). The ratios of K18 to K8 mRNA were plotted at the indicated concentrations of griseofulvin (third panel).

