Figure 6.
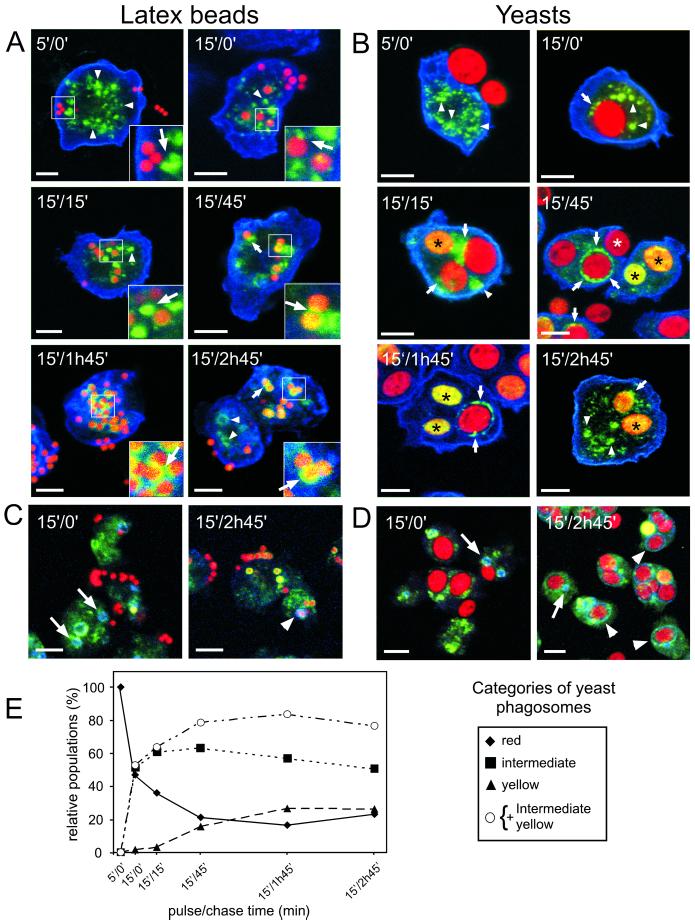
Visualization of delivery of CatD to maturing phagosomes and of its recycling before egestion. Cells were fed with either fluorescent LBs (red in A and C) or TRITC-labeled yeasts (red in B and D) according to the same pulse/chase regime as used for the purification. Cells were fixed and stained for CatD (green in A to D) and the plasma membrane marker PM4C4 (blue in A and B) or the secretory lysosome marker vacuolin (blue in C and D). During and shortly after uptake, the LBs and yeasts appeared red. Because of overlay of red and green, delivery of CatD colored (or circled) the particles yellow (black asterisks). After quantitative removal of CatD before egestion, the particles were red again (white asterisk). CatD was first present in small punctate lysosomes (arrowheads in A and B) that associated with the phagosome (arrows in A and B) either during the delivery (early time points) or removal of CatD (later time points). At early time points of phagocytosis, vacuolin was associated only with late secretory lysosomes (arrows in C and D) but was then recruited onto late phagosomes (arrowheads in C and D). At late time points, vacuolin-positive phagosomes were red again, showing that CatD had been removed right before egestion. (E) Presence of CatD was quantified in 2500 maturing phagosomes and attributed to one of the following categories: red for phagosomes that did not contain measurable level of CatD, yellow for phagosomes containing the highest levels of CatD, and intermediate for phagosomes containing either a homogeneous submaximal level of CatD and/or CatD in the form of punctate structures. The data are presented as a proportion of each category at every time point. Bars, 5 μm.

