Figure 6.
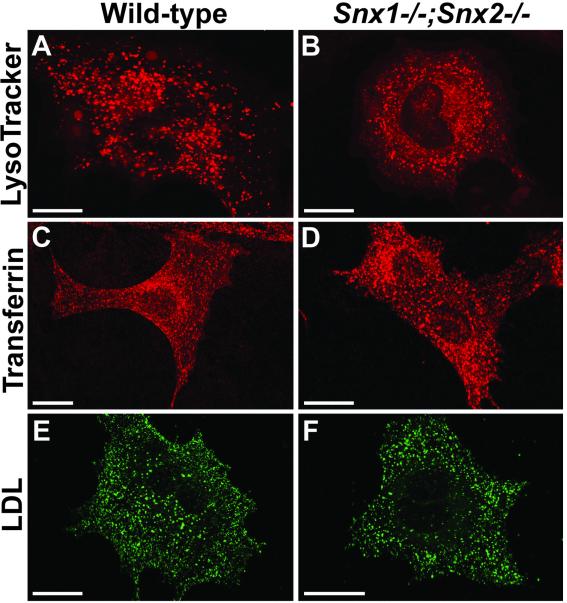
Confocal microscopy of primary embryonic fibroblasts. (A and B) Fluorescence pattern of acidic LysoTracker Red-positive compartments is shown in wild-type (A) and Snx1-/-; Snx2-/- (B) primary embryonic fibroblasts. (C and D) Distribution of fluorescent transferrin is shown in wild-type (C) and Snx1-/-; Snx2-/- (D) fibroblasts after 15 min of endocytic uptake. (E and F) Distribution of fluorescent LDL is shown in wild-type (E) and Snx1-/-; Snx2-/- (F) fibroblasts after 40 min of endocytic uptake. Bars, 20 μm.

