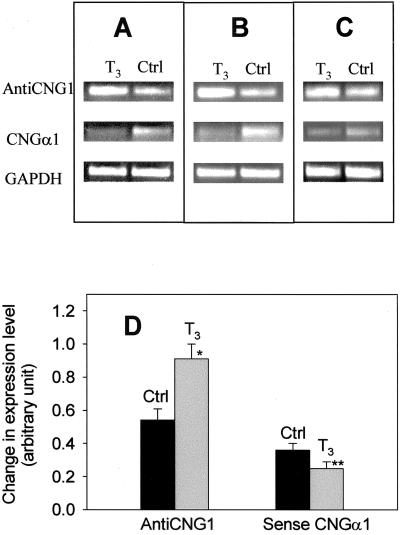
Figure 7.
The effect of thyroid hormone (T3) on the expression of anti-CNG1 and sense CNGα1 in human glioma cell T98 as detected by RT-PCR. (A–C) Three independent experiments. Top row, the expression of anti-CNG1; middle row, the expression of sense CNGα1; bottom row, the expression of GAPDH as control (Ctrl). T3 treatment increased the expression of anti-CNG1 but suppressed the expression of sense CNGα1. D, Relative expression. The intensity of the bands for anti-CNG1 and sense CNGα1 was divided by the intensity of the bands for the internal marker GAPDH (anti-CNG1/GAPDH or sense CNGα1/GAPDH). Values are means ± SEM (n = 8). *p<0.01 compared with control. **p<0.05 compared with control.

