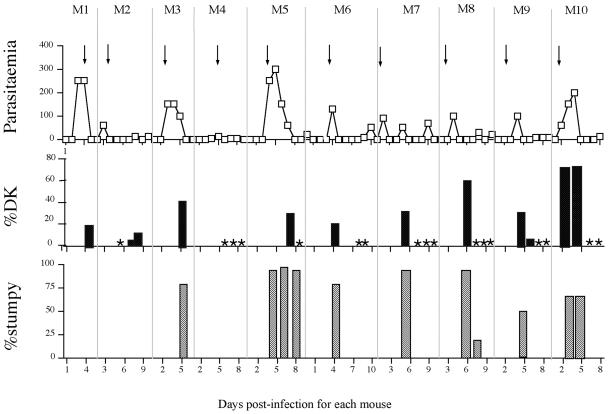
Figure 4.
Generation of dyskinetoplastid bloodstream forms by acriflavine dosage of infected rodents. Top, parasitaemia achieved for a consecutive series of 10 mouse infections, with each mouse being dosed with 2.5 mg kg−1 acriflavine as the parasitaemia approached 1 × 10⁸ parasites ml−1 (indicated by arrows). Scale, cell no. × 106 parasites/ml. Middle, percentage of DK cells in the population assessed at particular points during each parasitaemia. An asterisk indicates that a search for DK cells was carried out at that time point, but that <0.1% dyskinetoplastid cells was detected. Bottom, percentage of stumpy cells in each population assessed by morphological examination. The time at which each sample was taken, expressed as the number of days postinfection for each mouse (M1–M10) is shown at the bottom.

