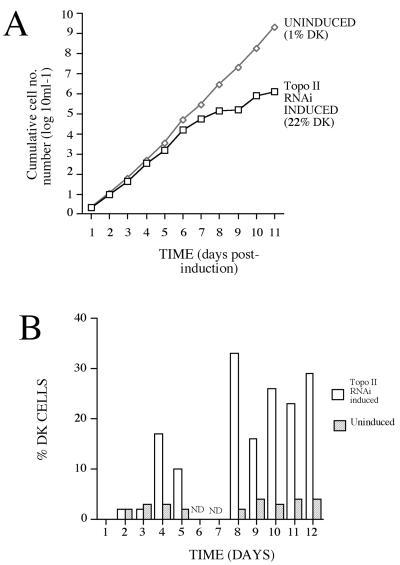
Figure 5.
Cell growth and the percentage of DK cells after transcript ablation for mitochondrial topoisomerase II. (A) Growth of cells transfected with the Topo II stem-loop construct, with RNAi either induced (+tetracycline) or not. The percentage of DK cells in each population is shown in each population 11 d after induction. (B) Kinetics of the appearance of DK cells where RNAi for Topo II is induced or not. DK cells are detected 4 d after induction and increased to a maximum of 35% of the population. ND, not done. Note that A and B are derived from independent experiments.

