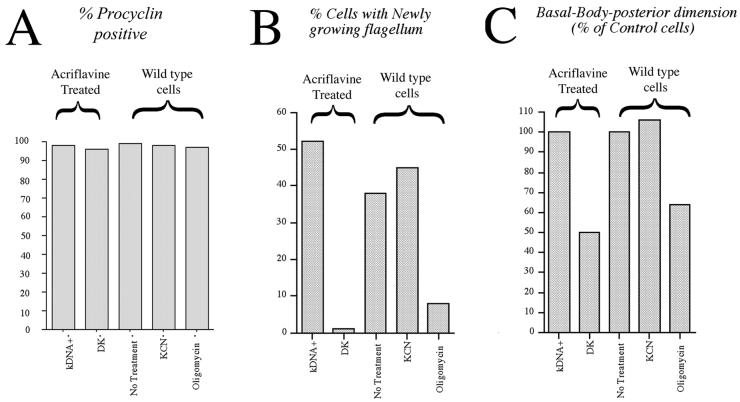
Figure 9.
Differentiation and cell cycle reentry for dyskinetoplast cells and cells exposed to metabolic inhibitors. (A) Procyclin expression, assessed by immunofluorescence, 24 h after exposure to differentiation triggers. kDNA+ and DK cells represent, respectively, the cells with or without a detectable kinetoplast in a population of stumpy forms isolated 16 h after exposure of the rodent host to a single dose of acriflavine. KCN represents wild-type stumpy form cells treated with 2 mM KCN throughout differentiation. Oligomycin represents wild-type stumpy form cells treated with 1.25 μg ml−1 oligomycin throughout differentiation. (B) Proportion of cells displaying new flagellum growth as assessed by YL1/2 staining, for the populations in A. (C) Basal Body-posterior dimension for the same cell populations as in A measured after 14 h (acriflavine-derived) or 18 h (wild-type cells). Each is expressed as a percentage of the Basal Body-posterior dimension in control cells at the same time point and represents an analysis 100 cells under each condition. Each set of data represents an average of two replicate experiments.

