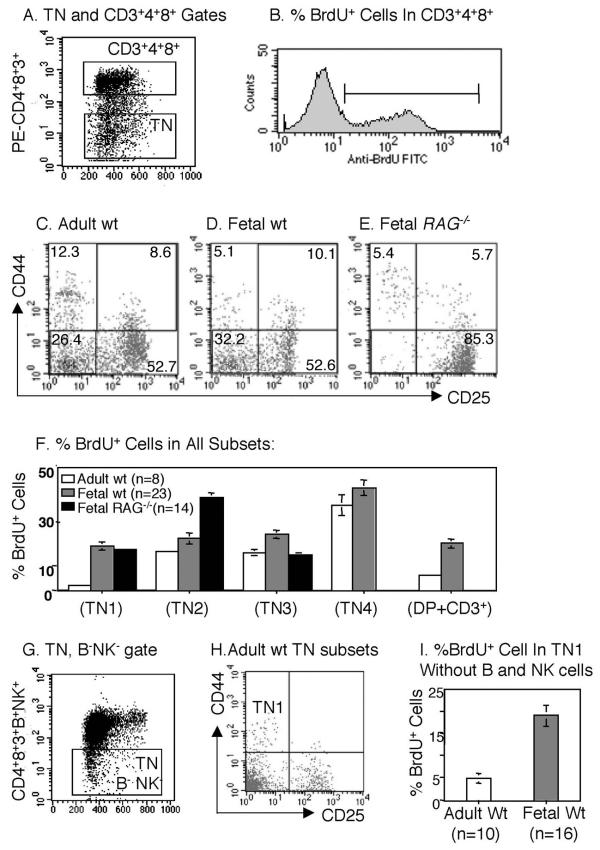
Figure 1.
DNA synthesis patterns of fetal vs. adult thymocyte subsets as measured by incorporation of BrdU A. Thymocytes were gated as either CD3-4-8- TN or CD3+4+8+ DP by cell surface marker expression and forward scatter (SP cells should be located between these two gates, and therefore excluded from analysis). B. Gate used for analysis of BrdU incorporation on gated subpopulations. Panels C-E show CD44 vs. CD25 dot plots of the gated CD3-4-8- population from 5–6 week old adult C57BL/6 (C), E17.5 fetal C57BL/6 (D), and E17.5 fetal RAG-/- (E). Percentages are shown in each quadrant. F. Percentages of BrdU+ cells (Mean ± SEM) in each subset of TN cells defined by CD44 and CD25, and in DP cells. G. Adult wild-type thymocytes were gated as CD3-4-8-B220-NK1.1-. H. CD44 vs. CD25 dot plots of the gated population from (G). I. Percentage of BrdU+ cells (mean ± SEM) in adult and fetal TN1 thymocytes excluding B and NK cells (H, G).

