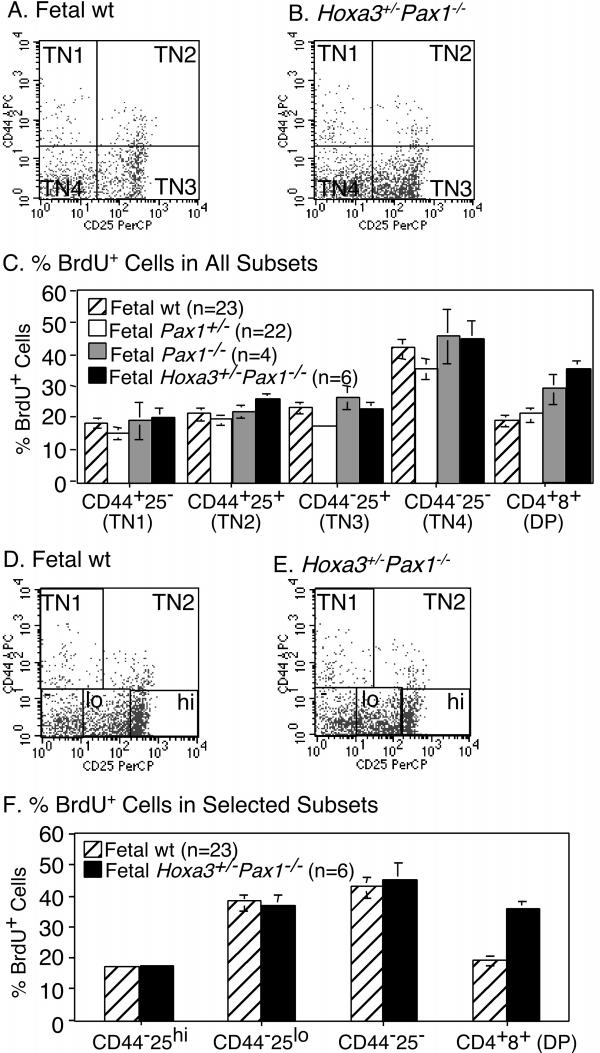
Figure 2.
Proliferation of E17.5 Hoxa3-Pax1 compound mutant thymocytes compared to wild type. Panels A-B show CD44 vs. CD25 dot plots of the gated CD3-4-8- population from E17.5 wild type (A) and Hoxa3+/-Pax1-/- (B) thymus. Percentages are shown in each quadrant. C. Percentages of BrdU+ cells (Mean ± SEM) in each of 4 subsets of TN cells defined by CD44 and CD25, and in DP cells. D, E. CD44 vs. CD25 dot plots of the gated CD3-4-8- population divided into five subsets as defined by [12]. F. Percentages of BrdU+ cells (Mean ± SEM) in each of 3 CD44- TN subsets defined in panels D and E. DP values shown for comparison are the same as in C.

