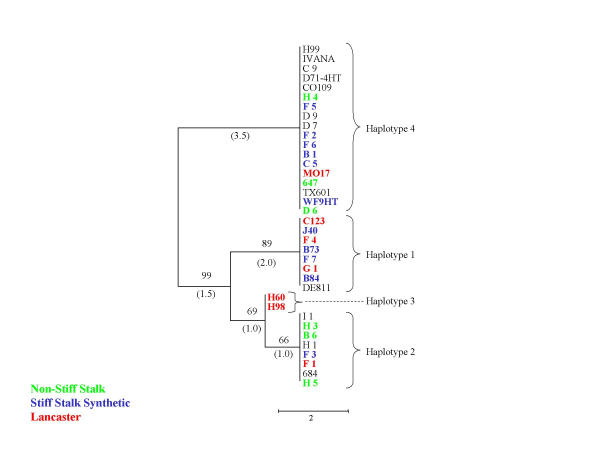
Figure 3.
Neighbor-joining trees representing stearoyl-ACP desaturase haplotype relationships. Level of support for branch points is indicated in %, and branch length expressed as nucleotide differences are shown in parentheses. Genotypes correspond to those of Table 1, and color indicates major heterotic groups: stiff stalk (blue), non stiff stalk (green) and Lancaster (red).

