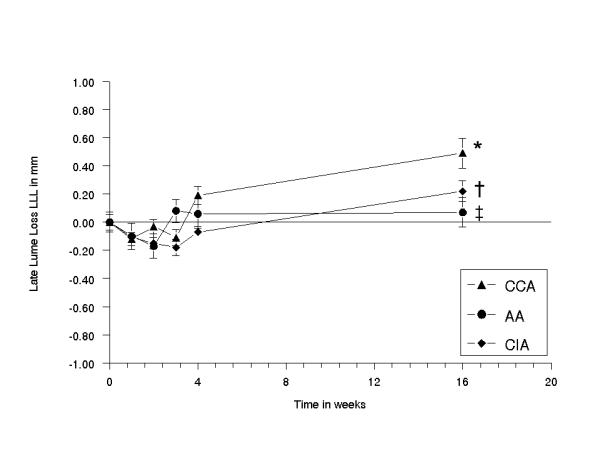
Figure 3.

Diagram showing the mean difference in lumen diameter (MLD) as the sum of MLD at 0 weeks minus MLD at 16 weeks of the common carotid, abdominal aorta and common iliac artery, plotted against the time in weeks. The error bars are standard errors of the mean (n = 5 for each time point). At 16 weeks: (*) CCA vs AA p < 0.0002; (†) CCA vs CIA p < 0.001; AA vs CIA (‡) p < 0.027.
