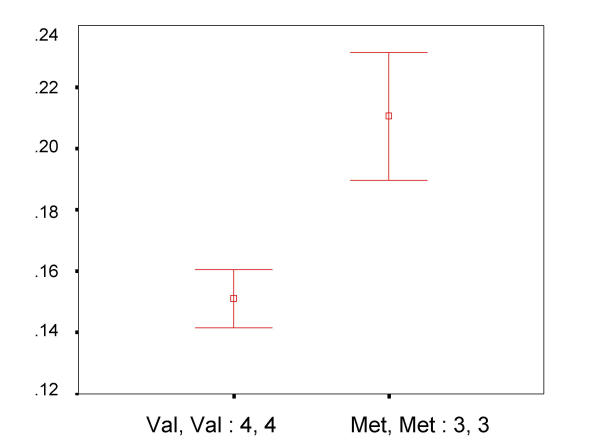
Figure 4.
Effect of 'high' vs. 'low' dopamine alleles on executive attention Comparison of normalized executive attention scores in genotypic classes expected to show high and low levels of dopamine. The Y-axis shows normalized executive attention scores (mean + SE). From the entire population, 30 subjects carried the COMT (Val, Val) and MAOA-LPR (4-repeat, 4-repeat) genotypes and are expected to have relatively lower dopamine levels than 20 subjects who carried the COMT (Met, Met) and MAOA-LPR (3-repeat, 3-repeat) genotypes. These distributions are referred to as 'low' dopamine and 'high' dopamine and are shown above.

