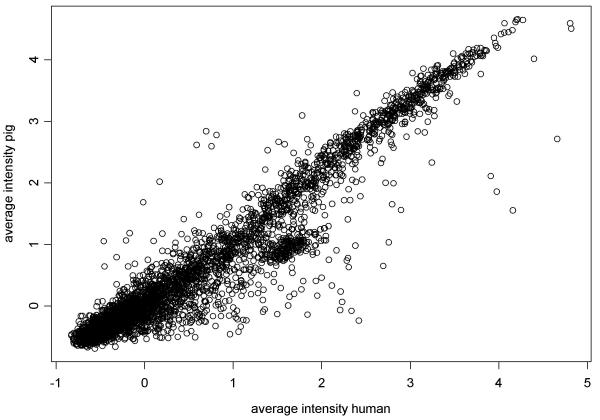
Figure 5.
Comparison of gene expression profiles generated from hybridisations of pig and human skeletal muscle RNA with a human cDNA nylon microarray. Data shown are the average median normalized and log transformed intensity of three hybridisations of human and pig skeletal muscle RNA with the GF211 human nylon cDNA microarray (ResGen) containing 4,324 human gene and EST sequences.

