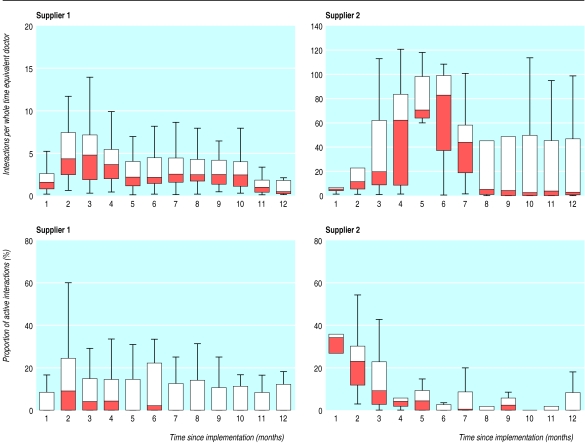
Figure 3.
Box plot of number of times guidelines were triggered per whole time equivalent general practitioner, and proportion of active interactions that involved going beyond first screen, by month of study and supplier. Lower and upper edges of each box represent the 25th and 75th centile of observed data. The line partitioning box corresponds to median observation. In several instances median observation was zero and is coincident with lower edge of box. Whiskers give range of data

