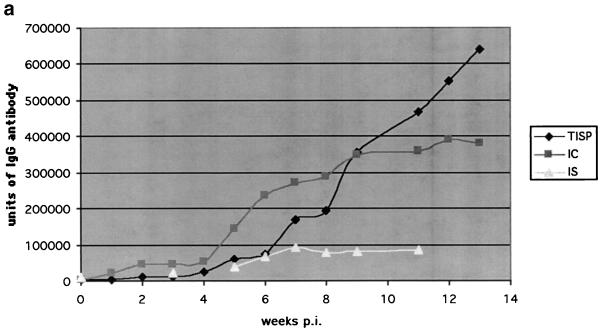
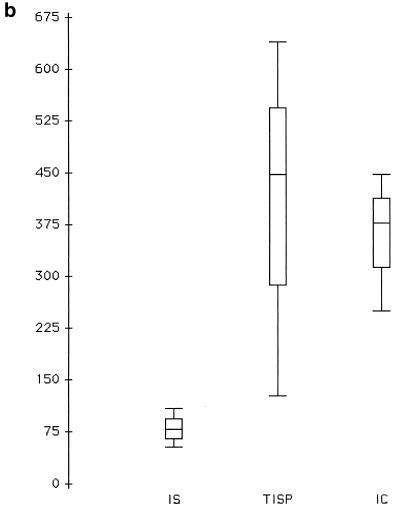
FIG. 1.
(a) Total IgG anti-B. burgdorferi antibody response. Amplitude of IgG anti-B. burgdorferi response, expressed as a mean, as a function over time p.i. for the three groups of infected NHPs. Units of amplitude were determined by comparison with a standard NHP anti-B. burgdorferi antiserum as described in Materials Methods. (b) Comparison of IgG antibody among groups at week 11 p.i. Week 11 was chosen as the date for comparison because it was the latest time p.i. available for all groups. The y axis represents units, and the x axis shows the three groups of NHPs in panel a. The hatched areas are 95% confidence intervals, and the lines of the box represent medians, range from 25th to 75th percentile, and the total range.


