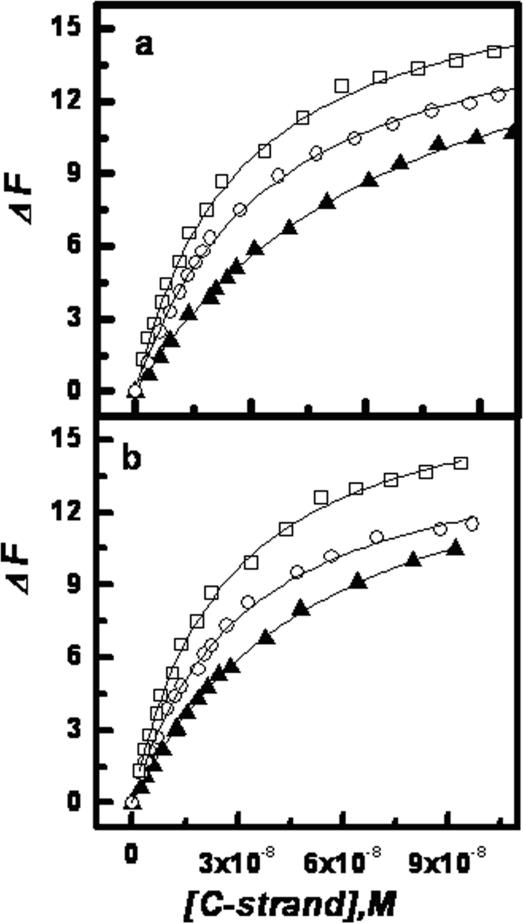
Figure 5.
(a) Plots of relative fluorescence emission intensity of Quadruplex-K+ (12 nM) at 520 nm (ΔF as described in the text) versus complementary strand concentration in KCl buffer, pH 7 at 20°C with different concentrations (wt/vol) of (a) ethylene glycol 0% (open square), 5% (open circle) and 10% (closed triangle) and (b) glycerol 0% (open square), 5% (open circle) and 10% (closed triangle).

