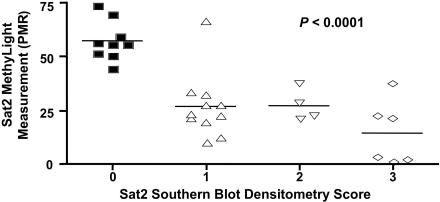
Figure 6.
MethyLight data (PMR) versus Southern blot-based Chr1 Sat2 hypomethylation densitometry scores. A score of 0, no hypomethylation; 1, small amounts of hypomethylation; 2, moderate hypomethylation; 3, strong hypomethylation on 7 normal tissues, two ICF cell lines, one control cell line and 20 cancer tissue samples (Wilms tumors and ovarian carcinomas). The data points are indicated by the squares (hypomethylation score = 0, upward triangles (hypomethylation score = 1), downward triangles (hypomethylation score = 2) and diamonds (hypomethylation score = 3). Mean PMR values are indicated by the horizontal bars. The significance of the association of both types of data after ANOVA analysis is shown.

