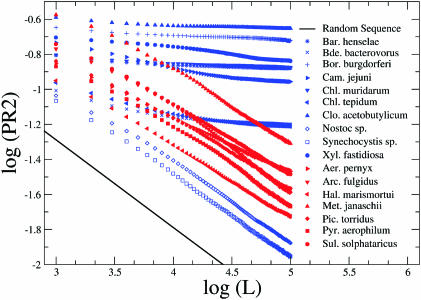
Figure 5.
Log-log plots of average root-squared PR2 deviations for two example sets of 10 eubacteria (blue) and 8 archaeabacteria (red). The majority of eubacteria produce slopes around zero while archaea appear to be close to the random behaviour as shown by the straight line in both panels. Two exceptional eubacterial cases (Nostoc sp. and Synechocystis, empty blue signs) share the behaviour of the archaea.

