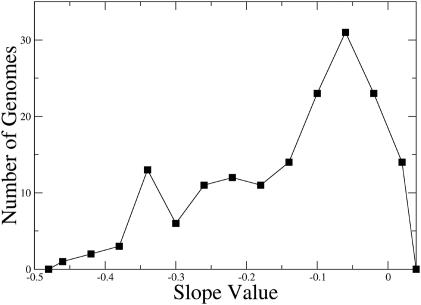
Figure 6.
Distribution of log-log average root-square PR2 deviation slope values for 161 bacterial species. The two peaks exhibit the two distinct modes. The one located near −0.4 is representative of the archaea while the larger one closer to zero corresponds to the eubacteria. In general, species with slope values below the boundary value of −0.3 produce unclear skew patterns indicating an alternative mode of replication.

