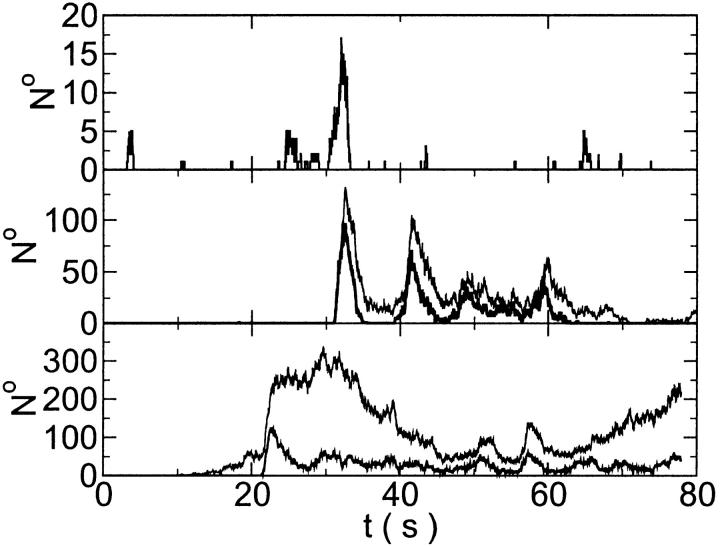
FIGURE 16.
Localization of release activity by slow buffer. Simulations with 
 and
and  and different amounts of added Ca2+: (top) 37 μM; (middle) 110 μM; and (bottom) 160 μM. The thick line shows the number of open channels at the focal site and the thin line the global number of open channels. All panels:


 without added Ca2+:

