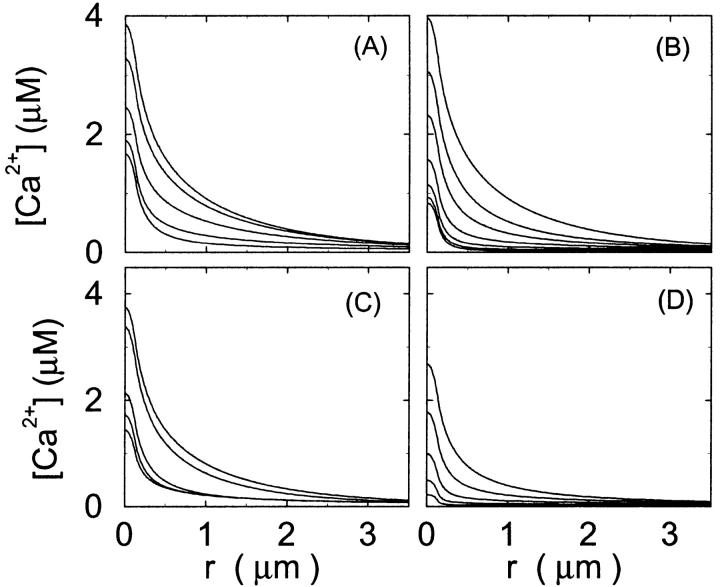
FIGURE 3.
Single cluster profiles of cytosolic Ca2+ for different parameters of the exogenous buffer. Parameters not mentioned are like in Table 1. (A) Lines from bottom to top 
 was kept constant; (B) Lines from bottom to top
  (C) Lines from bottom to top
  Kex is kept constant; (D) Lines from bottom to top

