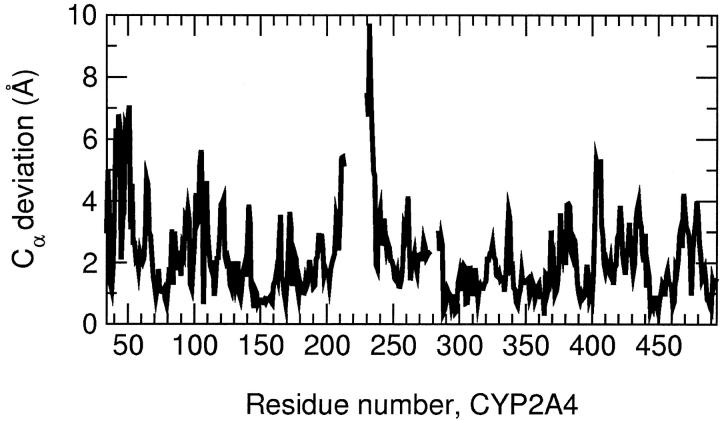
FIGURE 4.
Cα deviation between x-ray crystal CYP2C5 and solvent equilibrated CYP2A4. The deviation of the Cα positions was calculated after backbone atoms of the core residues of CYP2C5 and CYP2A4 (snapshot after 3 ns of dynamics) were superimposed. The gaps in the plot correspond to the regions missing in the x-ray crystal structure: the unresolved segment of the FG loop (residues 216-226) and the gap resulting from the alignment with CYP2A4 (residues 280-282).

