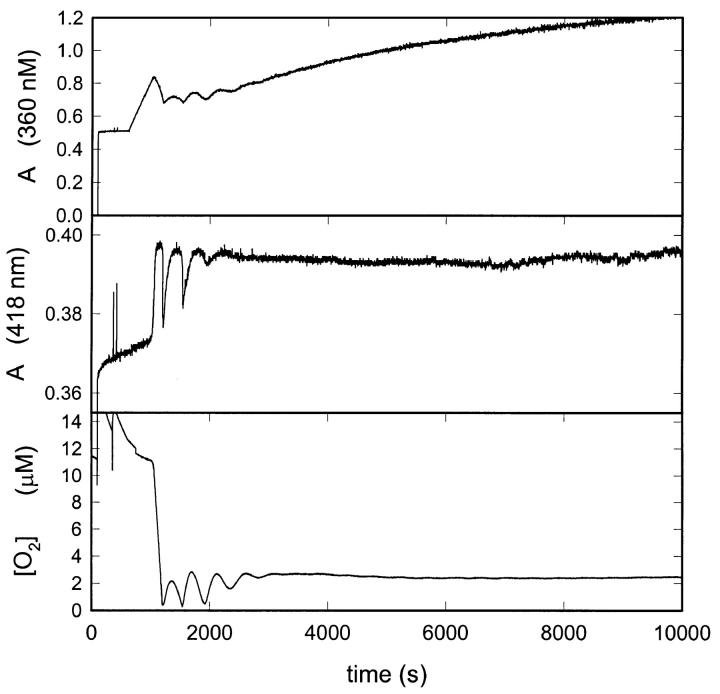
FIGURE 1.
Time series of the absorbance changes at 360 nm and 418 nm plus the oxygen concentration in the peroxidase-oxidase reaction catalyzed by peroxidase-containing liposomes. The reaction mixture contained liposomes corresponding to 0.25 mM phosphatidylcholine. Other experimental conditions as described in the experimental section.

