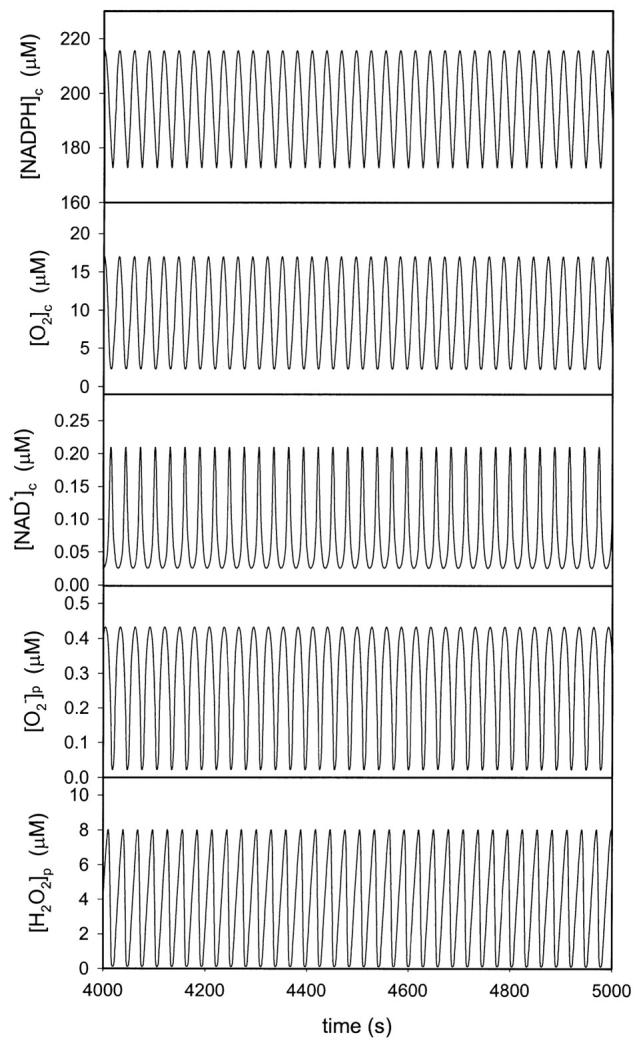
FIGURE 2.

Simulated time series of the concentrations of cytosolic NADPH, oxygen, and NADP· radical as well as superoxide and hydrogen peroxide in the phagosome. The simulations were made using the model listed in Table 1 and Table 2. The flux of formation of NADPH (k12) was set at 30 μM/s. Other parameters as listed in Table 1. The initial concentrations of ferric peroxidase and melatonin were both 300 μM. The initial concentration of all other substances was zero.
