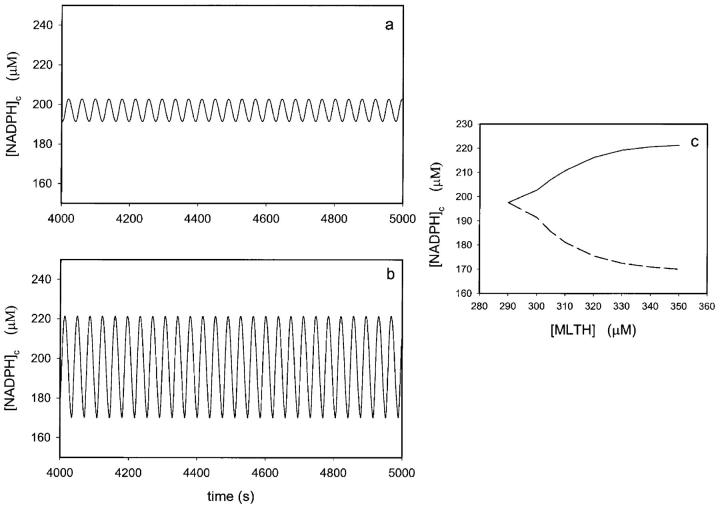
FIGURE 5.
Effect of the concentration of melatonin on the oscillation amplitude. Time series of [NADPH] in the presence of an initial concentration of melatonin of (a) 300 μM and (b) 350 μM. (c) Envelope of the oscillations of NADPH plotted against the concentration of melatonin ([MLTH]) in the cytoplasm. The NADPH influx rate was 30 μM/s and the initial concentration of ferric peroxidase was 200 μM. Other conditions as in Fig. 2.

