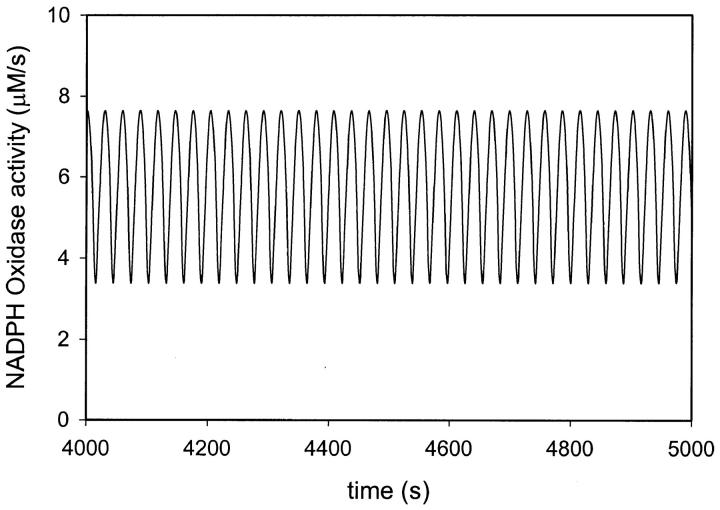
FIGURE 6.
Simulated changes of activity of NADPH oxidase (reaction (19) in Table 1). The flux of formation of NADPH (k12) was set at 30 μM/s. Other parameters as in Table 1. The initial concentrations of ferric peroxidase and melatonin were both 300 μM. The initial concentration of all other substances was zero.

