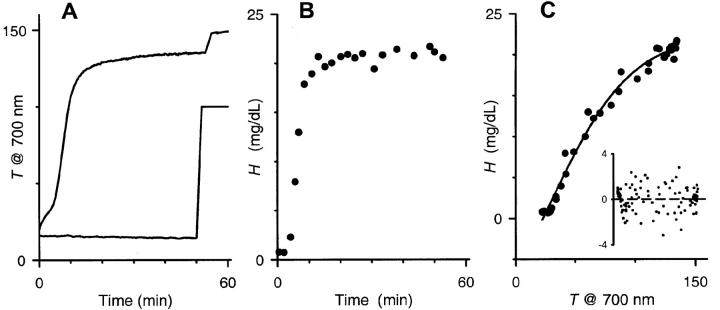
FIGURE 1.
Time course of osmotic lysis measured with a light scattering assay. (A) Suspensions of trophozoite-stage infected RBCs (upper curve) or uninfected RBCs (lower curve) in sorbitol lysis solution were continuously monitored at 700 nm. The transmittance time courses are shown here in arbitrary units. The abrupt increases at ∼50 min correspond to the addition of saponin, which lyses both uninfected and infected RBCs and releases any trapped hemoglobin. (B) Hemoglobin release measurements with an equivalent aliquot of the infected RBC suspension used in (A), both performed at 37°C. Measurements with uninfected RBCs produced negligible hemoglobin release (not shown). (C) Relationship between % transmittance (T) and released hemoglobin (H) for this infected RBC experiment. Plot shows measurements pooled with another T-H pair from the same culture. Solid line represents the least-squares fit to H = b0 +b1/(1 + exp(−(T − b2)/b3)). Inset shows the residuals from three separate experiments for this fit. Notice the uniform distribution of these residuals about the x axis. Dashed line represents a least-squares fit to a straight line; it demonstrates an average residual of zero at all transmittances, indicating that the equation used in Fig. 3 B does not introduce bias.

