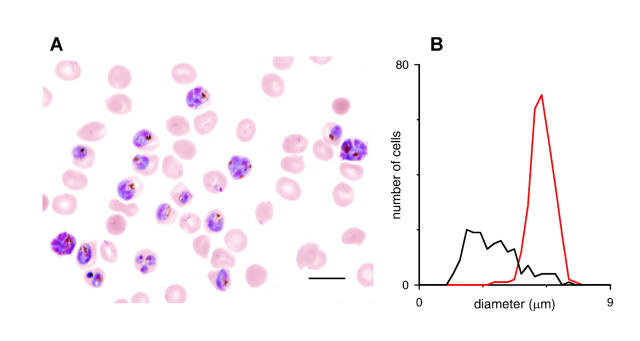
FIGURE 4.
Size distributions of intracellular parasites and RBCs. (A) Light micrograph of a parasite culture grown to ∼30% parasitemia, fixed on a glass slide, and stained with Giemsa. With this stain, parasites appear as heterogeneous blue and red structures within a light-colored RBC cytosol. Scale bar, 10 μm. (B) Histogram of intracellular parasite and RBC diameters, black and red curves, respectively. Mean cell diameters were measured from light micrographs by eye with Photoshop (Adobe Systems, San Jose, CA). Notice that cell-to-cell variation in Vi (related to RBC diameter, red curve) is modest, but that variation is N (related to parasite diameter, black curve) is greater. Notice also that Vi for infected and uninfected RBCs are grossly identical.

