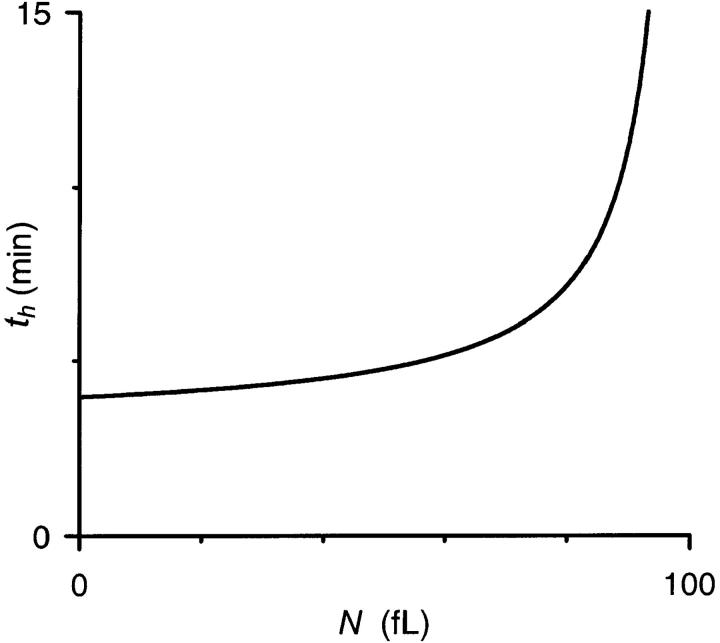
FIGURE 5.
Dependence of th on N. Plot shows calculated th for a range of N using Eq. 10 and physiological values of PS, Vi, and d (1.95 × 10⁻⁷ cm/sec, 100 fl, and 6.6 μm, respectively). Notice that th is only modestly affected by physiological variations in N, the population mean of which varied between 39 and 71 fl in 12 separate experiments.

