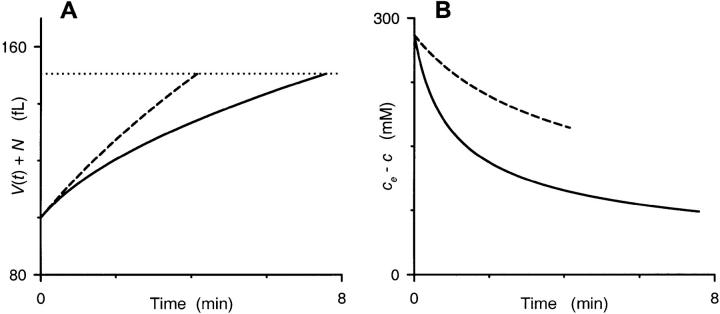
FIGURE 6.
Our model's predicted time course for single RBC volumes. Numerical integration of Eq. 2 was performed with values of PS, Vi, A, and ce appropriate for our osmotic lysis experiments (1.95 × 10⁻⁷ cm/sec, 100 fl, 136.9 μm2, and 280 mM, respectively). We used two extreme values of N, 20 fl (dashed curves) and 82 fl (solid curves), in iterative calculations of c(t) and V(t) in 0.001 min increments from 0 to 8 min. (A) shows the time course of total cell volume (given by V(t) + N) for these two RBCs. The volume of both RBCs increases monotonically, albeit at different rates, until a spherical shape is reached at a total cell volume of 150.5 fl, as indicated by the dotted horizontal line. Notice that the cell with a larger parasite (solid curve) takes significantly longer to reach this lysis threshold. (B) shows the time course of sorbitol accumulation in these two hypothetical RBCs, plotted as the difference between the constant extracellular sorbitol concentration (280 mM) and the numerically integrated intracellular concentration, c(t), to demonstrate the instantaneous gradient for sorbitol entry. Both curves are graphically terminated at the corresponding lysis times from (A). Notice that the RBC with a small parasite (dashed curve) maintains a larger gradient for t > 0, explaining why it reaches the lysis threshold sooner.

