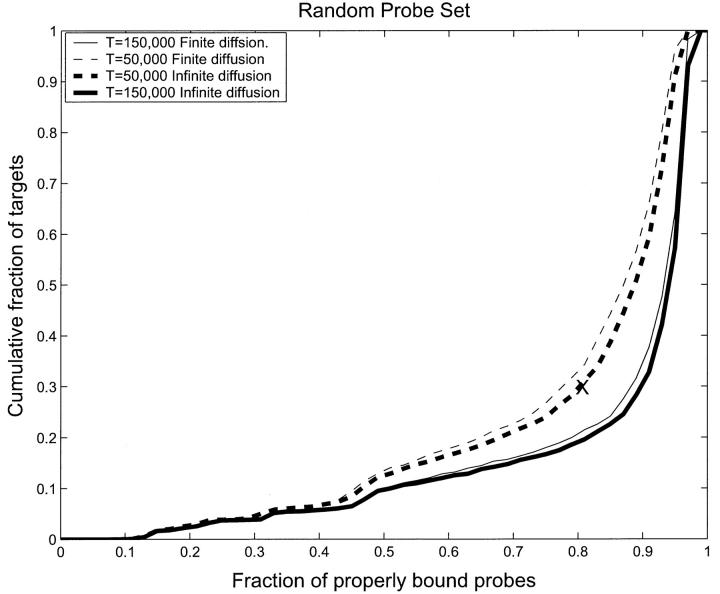
FIGURE 5.
Cumulative fraction of properly bound targets as a function of the probability that a probe is properly bound for the RPS. Thus the point (0.8, 0.3) (marked with an X), represents the case when 30% of targets are correctly bound to their appropriate probe in less than 80% of the possible cases. Ideally, if everything was correctly bound, the curve would be zero for all values, except at unity when it would be unity. The trend toward this can be seen in the data. The dashed curves represent T = 50,000 s and the full curves represent T = 150,000 s. One observes a slow improvement in binding after T = 50,000 s, but perfect binding is never achieved, even in equilibrium. The thick lines, dashed and full, represent infinite diffusion as defined in the text, whereas the thin lines represent finite diffusion. The difference between these two is small.

