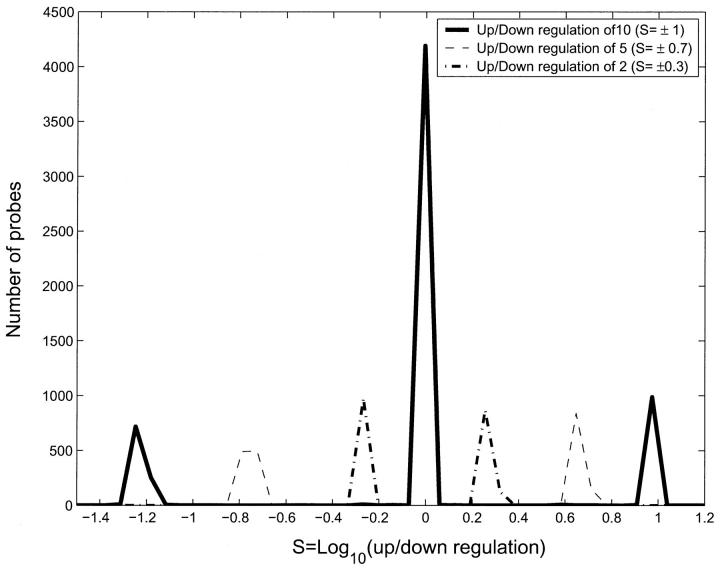
FIGURE 9.
Histogram of number of probes as a function of S for OPS. 4213 probes were not regulated and have S values close to 0. In each experiment 1000 probes were upregulated and 1000 probes were downregulated. Probes which were up-/downregulated by a factor of 10 have S values of ± 1. Probes which were up-/downregulated by a factor of 5 have S values of ± log10(5) and so on. The correlation between the up-/downregulation of the targets and the value of S is clear from the figure. This excellent correlation comes from the probe selection algorithm, which select probes for an optimal specificity. Note the bias toward upregulated genes. If the experimental sensitivity is |S| > 1.1 then we will be able to measure upregulation by a factor of 10 but not downregulation by the same factor. This is a residue of the concentration-dependent bias discussed in the text, which is reduced but not eliminated for the OPS.

